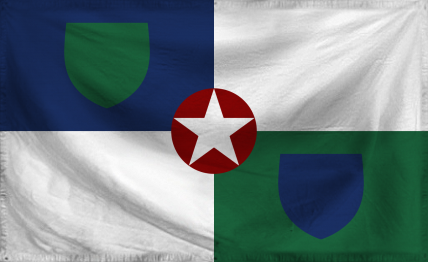
Northern Shartland Domestic Statistics
| Government Category: |
Socialist Stratocracy |
| Government Priority: |
Administration |
| Economic Rating: |
Frightening |
| Civil Rights Rating: |
Excellent |
| Political Freedoms: |
Some |
| Income Tax Rate: |
81% |
| Consumer Confidence Rate: |
107% |
| Worker Enthusiasm Rate: |
106% |
| Major Industry: |
Information Technology |
| National Animal: |
Skunk |
|
Northern Shartland Demographics
| Total Population: |
1,622,000,000 |
| Criminals: |
84,958,582 |
| Elderly, Disabled, & Retirees: |
133,440,293 |
| Military & Reserves: ? |
46,082,235 |
| Students and Youth: |
364,625,600 |
| Unemployed but Able: |
185,600,800 |
| Working Class: |
807,292,489 |
|
|
|
Northern Shartland Government Budget Details
| Government Budget: |
$57,277,942,122,172.90 |
| Government Expenditures: |
$53,841,265,594,842.52 |
| Goverment Waste: |
$3,436,676,527,330.38 |
| Goverment Efficiency: |
94% |
|
Northern Shartland Government Spending Breakdown:
| Administration: |
$9,153,015,151,123.23 |
17% |
| Social Welfare: |
$5,384,126,559,484.25 |
10% |
| Healthcare: |
$4,307,301,247,587.40 |
8% |
| Education: |
$8,614,602,495,174.80 |
16% |
| Religion & Spirituality: |
$0.00 |
0% |
| Defense: |
$4,845,713,903,535.83 |
9% |
| Law & Order: |
$3,768,888,591,638.98 |
7% |
| Commerce: |
$5,384,126,559,484.25 |
10% |
| Public Transport: |
$3,230,475,935,690.55 |
6% |
| The Environment: |
$3,768,888,591,638.98 |
7% |
| Social Equality: |
$4,307,301,247,587.40 |
8% |
|
|
|
Northern Shartland White Market Statistics ?
| Gross Domestic Product: |
$43,419,200,000,000.00 |
| GDP Per Capita: |
$26,768.93 |
| Average Salary Per Employee: |
$39,650.98 |
| Unemployment Rate: |
6.05% |
| Consumption: |
$12,270,753,986,641.92 |
| Exports: |
$7,764,284,731,392.00 |
| Imports: |
$7,723,899,944,960.00 |
| Trade Net: |
40,384,786,432.00 |
|
Northern Shartland Grey and Black Market Statistics ?
Evasion, Black Market, Barter & Crime
| Black & Grey Markets Combined: |
$84,394,793,487,264.83 |
| Avg Annual Criminal's Income / Savings: ? |
$72,614.32 |
| Recovered Product + Fines & Fees: |
$4,430,726,658,081.40 |
|
Black Market & Grey Market Statistics:
| Guns & Weapons: |
$2,051,078,314,168.55 |
| Drugs and Pharmaceuticals: |
$3,646,361,447,410.76 |
| Extortion & Blackmail: |
$6,153,234,942,505.66 |
| Counterfeit Goods: |
$4,899,798,194,958.21 |
| Trafficking & Intl Sales: |
$2,165,027,109,400.14 |
| Theft & Disappearance: |
$3,646,361,447,410.76 |
| Counterfeit Currency & Instruments : |
$6,495,081,328,200.42 |
| Illegal Mining, Logging, and Hunting : |
$2,278,975,904,631.73 |
| Basic Necessitites : |
$5,013,746,990,189.80 |
| School Loan Fraud : |
$4,444,003,014,031.87 |
| Tax Evasion + Barter Trade : |
$36,289,761,199,523.88 |
|
|
|
Northern Shartland Total Market Statistics ?
| National Currency: |
Shart |
| Exchange Rates: |
1 Shart = $1.52 |
| |
$1 = 0.66 Sharts |
| |
Regional Exchange Rates |
| Gross Domestic Product: |
$43,419,200,000,000.00 - 34% |
| Black & Grey Markets Combined: |
$84,394,793,487,264.83 - 66% |
| Real Total Economy: |
$127,813,993,487,264.83 |
|


