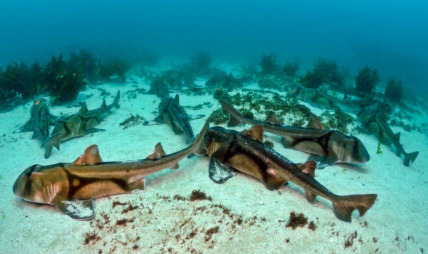
Port Jackson Shark Domestic Statistics
| Government Category: |
Commonwealth |
| Government Priority: |
Defence |
| Economic Rating: |
Strong |
| Civil Rights Rating: |
Some |
| Political Freedoms: |
Very Good |
| Income Tax Rate: |
31% |
| Consumer Confidence Rate: |
99% |
| Worker Enthusiasm Rate: |
101% |
| Major Industry: |
Arms Manufacturing |
| National Animal: |
Port Jackson Shark |
|
Port Jackson Shark Demographics
| Total Population: |
6,207,000,000 |
| Criminals: |
651,562,505 |
| Elderly, Disabled, & Retirees: |
810,580,441 |
| Military & Reserves: ? |
322,902,418 |
| Students and Youth: |
1,098,949,350 |
| Unemployed but Able: |
955,054,223 |
| Working Class: |
2,367,951,064 |
|
|
|
Port Jackson Shark Government Budget Details
| Government Budget: |
$26,173,726,416,835.71 |
| Government Expenditures: |
$25,388,514,624,330.64 |
| Goverment Waste: |
$785,211,792,505.07 |
| Goverment Efficiency: |
97% |
|
Port Jackson Shark Government Spending Breakdown:
| Administration: |
$2,792,736,608,676.37 |
11% |
| Social Welfare: |
$1,777,196,023,703.14 |
7% |
| Healthcare: |
$1,777,196,023,703.14 |
7% |
| Education: |
$2,792,736,608,676.37 |
11% |
| Religion & Spirituality: |
$507,770,292,486.61 |
2% |
| Defense: |
$5,077,702,924,866.13 |
20% |
| Law & Order: |
$3,300,506,901,162.98 |
13% |
| Commerce: |
$2,031,081,169,946.45 |
8% |
| Public Transport: |
$1,523,310,877,459.84 |
6% |
| The Environment: |
$1,269,425,731,216.53 |
5% |
| Social Equality: |
$2,538,851,462,433.06 |
10% |
|
|
|
Port Jackson Shark White Market Statistics ?
| Gross Domestic Product: |
$21,502,000,000,000.00 |
| GDP Per Capita: |
$3,464.15 |
| Average Salary Per Employee: |
$5,901.69 |
| Unemployment Rate: |
22.59% |
| Consumption: |
$42,874,896,824,401.91 |
| Exports: |
$8,585,322,414,080.00 |
| Imports: |
$8,619,339,284,480.00 |
| Trade Net: |
-34,016,870,400.00 |
|
Port Jackson Shark Grey and Black Market Statistics ?
Evasion, Black Market, Barter & Crime
| Black & Grey Markets Combined: |
$59,156,832,414,220.47 |
| Avg Annual Criminal's Income / Savings: ? |
$7,800.02 |
| Recovered Product + Fines & Fees: |
$5,767,791,160,386.50 |
|
Black Market & Grey Market Statistics:
| Guns & Weapons: |
$3,119,254,735,255.25 |
| Drugs and Pharmaceuticals: |
$2,054,143,362,241.26 |
| Extortion & Blackmail: |
$2,891,016,583,895.11 |
| Counterfeit Goods: |
$4,716,921,794,776.23 |
| Trafficking & Intl Sales: |
$1,445,508,291,947.55 |
| Theft & Disappearance: |
$2,586,699,048,748.26 |
| Counterfeit Currency & Instruments : |
$5,173,398,097,496.51 |
| Illegal Mining, Logging, and Hunting : |
$1,217,270,140,587.41 |
| Basic Necessitites : |
$2,662,778,432,534.97 |
| School Loan Fraud : |
$2,054,143,362,241.26 |
| Tax Evasion + Barter Trade : |
$25,437,437,938,114.80 |
|
|
|
Port Jackson Shark Total Market Statistics ?
| National Currency: |
Apexia |
| Exchange Rates: |
1 Apexia = $0.29 |
| |
$1 = 3.42 Apexias |
| |
Regional Exchange Rates |
| Gross Domestic Product: |
$21,502,000,000,000.00 - 27% |
| Black & Grey Markets Combined: |
$59,156,832,414,220.47 - 73% |
| Real Total Economy: |
$80,658,832,414,220.47 |
|


