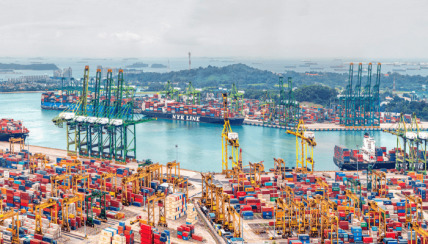
Port of Singapore Domestic Statistics
| Government Category: |
Republic |
| Government Priority: |
Defence |
| Economic Rating: |
Frightening |
| Civil Rights Rating: |
Rare |
| Political Freedoms: |
Few |
| Income Tax Rate: |
71% |
| Consumer Confidence Rate: |
98% |
| Worker Enthusiasm Rate: |
99% |
| Major Industry: |
Arms Manufacturing |
| National Animal: |
NKB |
|
Port of Singapore Demographics
| Total Population: |
3,704,000,000 |
| Criminals: |
248,174,739 |
| Elderly, Disabled, & Retirees: |
379,245,566 |
| Military & Reserves: ? |
212,934,755 |
| Students and Youth: |
750,430,400 |
| Unemployed but Able: |
458,300,570 |
| Working Class: |
1,654,913,970 |
|
|
|
Port of Singapore Government Budget Details
| Government Budget: |
$96,633,861,927,537.22 |
| Government Expenditures: |
$88,903,152,973,334.25 |
| Goverment Waste: |
$7,730,708,954,202.97 |
| Goverment Efficiency: |
92% |
|
Port of Singapore Government Spending Breakdown:
| Administration: |
$8,890,315,297,333.43 |
10% |
| Social Welfare: |
$1,778,063,059,466.69 |
2% |
| Healthcare: |
$9,779,346,827,066.77 |
11% |
| Education: |
$10,668,378,356,800.11 |
12% |
| Religion & Spirituality: |
$1,778,063,059,466.69 |
2% |
| Defense: |
$16,891,599,064,933.51 |
19% |
| Law & Order: |
$16,002,567,535,200.16 |
18% |
| Commerce: |
$11,557,409,886,533.45 |
13% |
| Public Transport: |
$2,667,094,589,200.03 |
3% |
| The Environment: |
$4,445,157,648,666.71 |
5% |
| Social Equality: |
$4,445,157,648,666.71 |
5% |
|
|
|
Port of Singapore White Market Statistics ?
| Gross Domestic Product: |
$71,000,500,000,000.00 |
| GDP Per Capita: |
$19,168.60 |
| Average Salary Per Employee: |
$27,055.81 |
| Unemployment Rate: |
9.95% |
| Consumption: |
$36,578,413,531,627.52 |
| Exports: |
$16,014,406,057,984.00 |
| Imports: |
$16,006,254,690,304.00 |
| Trade Net: |
8,151,367,680.00 |
|
Port of Singapore Grey and Black Market Statistics ?
Evasion, Black Market, Barter & Crime
| Black & Grey Markets Combined: |
$286,618,744,352,245.94 |
| Avg Annual Criminal's Income / Savings: ? |
$103,486.29 |
| Recovered Product + Fines & Fees: |
$38,693,530,487,553.20 |
|
Black Market & Grey Market Statistics:
| Guns & Weapons: |
$13,778,443,760,530.30 |
| Drugs and Pharmaceuticals: |
$12,718,563,471,258.74 |
| Extortion & Blackmail: |
$16,251,497,768,830.61 |
| Counterfeit Goods: |
$28,616,767,810,332.16 |
| Trafficking & Intl Sales: |
$4,592,814,586,843.43 |
| Theft & Disappearance: |
$11,305,389,752,229.99 |
| Counterfeit Currency & Instruments : |
$26,497,007,231,789.04 |
| Illegal Mining, Logging, and Hunting : |
$4,592,814,586,843.43 |
| Basic Necessitites : |
$7,419,162,024,900.93 |
| School Loan Fraud : |
$10,245,509,462,958.43 |
| Tax Evasion + Barter Trade : |
$123,246,060,071,465.75 |
|
|
|
Port of Singapore Total Market Statistics ?
| National Currency: |
NKB |
| Exchange Rates: |
1 NKB = $1.29 |
| |
$1 = 0.78 NKBs |
| |
Regional Exchange Rates |
| Gross Domestic Product: |
$71,000,500,000,000.00 - 20% |
| Black & Grey Markets Combined: |
$286,618,744,352,245.94 - 80% |
| Real Total Economy: |
$357,619,244,352,245.94 |
|


