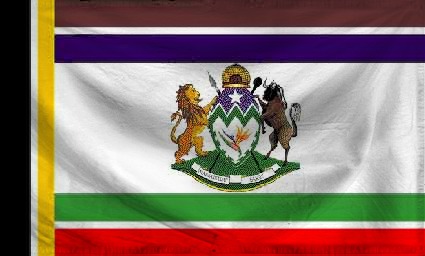
Queen Silomo Domestic Statistics
| Government Category: |
Zulu Queendom |
| Government Priority: |
Defence |
| Economic Rating: |
Strong |
| Civil Rights Rating: |
Frightening |
| Political Freedoms: |
Corrupted |
| Income Tax Rate: |
6% |
| Consumer Confidence Rate: |
99% |
| Worker Enthusiasm Rate: |
101% |
| Major Industry: |
Retail |
| National Animal: |
Leopard |
|
Queen Silomo Demographics
| Total Population: |
17,595,000,000 |
| Criminals: |
2,265,942,043 |
| Elderly, Disabled, & Retirees: |
2,251,405,695 |
| Military & Reserves: ? |
1,241,681,231 |
| Students and Youth: |
2,878,542,000 |
| Unemployed but Able: |
2,808,150,552 |
| Working Class: |
6,149,278,478 |
|
|
|
Queen Silomo Government Budget Details
| Government Budget: |
$27,558,669,815,119.87 |
| Government Expenditures: |
$23,424,869,342,851.89 |
| Goverment Waste: |
$4,133,800,472,267.98 |
| Goverment Efficiency: |
85% |
|
Queen Silomo Government Spending Breakdown:
| Administration: |
$2,810,984,321,142.23 |
12% |
| Social Welfare: |
$3,747,979,094,856.30 |
16% |
| Healthcare: |
$3,747,979,094,856.30 |
16% |
| Education: |
$2,810,984,321,142.23 |
12% |
| Religion & Spirituality: |
$0.00 |
0% |
| Defense: |
$6,558,963,415,998.53 |
28% |
| Law & Order: |
$936,994,773,714.08 |
4% |
| Commerce: |
$0.00 |
0% |
| Public Transport: |
$2,810,984,321,142.23 |
12% |
| The Environment: |
$0.00 |
0% |
| Social Equality: |
$0.00 |
0% |
|
|
|
Queen Silomo White Market Statistics ?
| Gross Domestic Product: |
$19,898,400,000,000.00 |
| GDP Per Capita: |
$1,130.91 |
| Average Salary Per Employee: |
$2,103.12 |
| Unemployment Rate: |
24.99% |
| Consumption: |
$165,409,208,244,633.59 |
| Exports: |
$22,427,917,090,816.00 |
| Imports: |
$23,842,766,454,784.00 |
| Trade Net: |
-1,414,849,363,968.00 |
|
Queen Silomo Grey and Black Market Statistics ?
Evasion, Black Market, Barter & Crime
| Black & Grey Markets Combined: |
$37,474,962,268,498.72 |
| Avg Annual Criminal's Income / Savings: ? |
$1,406.32 |
| Recovered Product + Fines & Fees: |
$1,124,248,868,054.96 |
|
Black Market & Grey Market Statistics:
| Guns & Weapons: |
$2,900,786,929,355.41 |
| Drugs and Pharmaceuticals: |
$2,279,189,730,207.82 |
| Extortion & Blackmail: |
$1,243,194,398,295.18 |
| Counterfeit Goods: |
$1,864,791,597,442.76 |
| Trafficking & Intl Sales: |
$1,243,194,398,295.18 |
| Theft & Disappearance: |
$1,657,592,531,060.24 |
| Counterfeit Currency & Instruments : |
$3,107,985,995,737.94 |
| Illegal Mining, Logging, and Hunting : |
$621,597,199,147.59 |
| Basic Necessitites : |
$2,279,189,730,207.82 |
| School Loan Fraud : |
$1,243,194,398,295.18 |
| Tax Evasion + Barter Trade : |
$16,114,233,775,454.45 |
|
|
|
Queen Silomo Total Market Statistics ?
| National Currency: |
Rand |
| Exchange Rates: |
1 Rand = $0.17 |
| |
$1 = 5.98 Rands |
| |
Regional Exchange Rates |
| Gross Domestic Product: |
$19,898,400,000,000.00 - 35% |
| Black & Grey Markets Combined: |
$37,474,962,268,498.72 - 65% |
| Real Total Economy: |
$57,373,362,268,498.72 |
|


