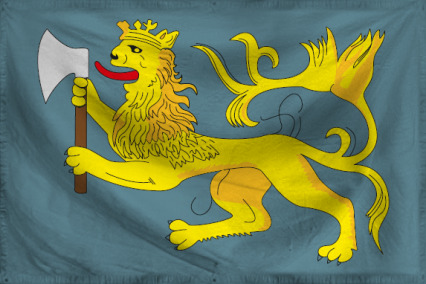
Saint Olav Domestic Statistics
| Government Category: |
Patrimonium |
| Government Priority: |
Education |
| Economic Rating: |
Frightening |
| Civil Rights Rating: |
Superb |
| Political Freedoms: |
Some |
| Income Tax Rate: |
93% |
| Consumer Confidence Rate: |
108% |
| Worker Enthusiasm Rate: |
107% |
| Major Industry: |
Tourism |
| National Animal: |
Crowned Lion |
|
Saint Olav Demographics
| Total Population: |
21,223,000,000 |
| Criminals: |
1,000,819,182 |
| Elderly, Disabled, & Retirees: |
1,449,069,492 |
| Military & Reserves: ? |
817,156,307 |
| Students and Youth: |
5,073,358,150 |
| Unemployed but Able: |
2,350,360,023 |
| Working Class: |
10,532,236,846 |
|
|
|
Saint Olav Government Budget Details
| Government Budget: |
$862,179,080,506,452.25 |
| Government Expenditures: |
$810,448,335,676,065.12 |
| Goverment Waste: |
$51,730,744,830,387.12 |
| Goverment Efficiency: |
94% |
|
Saint Olav Government Spending Breakdown:
| Administration: |
$40,522,416,783,803.26 |
5% |
| Social Welfare: |
$72,940,350,210,845.86 |
9% |
| Healthcare: |
$137,776,217,064,931.08 |
17% |
| Education: |
$137,776,217,064,931.08 |
17% |
| Religion & Spirituality: |
$0.00 |
0% |
| Defense: |
$97,253,800,281,127.81 |
12% |
| Law & Order: |
$48,626,900,140,563.91 |
6% |
| Commerce: |
$81,044,833,567,606.52 |
10% |
| Public Transport: |
$40,522,416,783,803.26 |
5% |
| The Environment: |
$72,940,350,210,845.86 |
9% |
| Social Equality: |
$40,522,416,783,803.26 |
5% |
|
|
|
Saint Olav White Market Statistics ?
| Gross Domestic Product: |
$657,744,000,000,000.00 |
| GDP Per Capita: |
$30,992.04 |
| Average Salary Per Employee: |
$46,909.11 |
| Unemployment Rate: |
4.51% |
| Consumption: |
$60,300,375,810,375.69 |
| Exports: |
$108,311,493,476,352.00 |
| Imports: |
$100,789,469,052,928.00 |
| Trade Net: |
7,522,024,423,424.00 |
|
Saint Olav Grey and Black Market Statistics ?
Evasion, Black Market, Barter & Crime
| Black & Grey Markets Combined: |
$1,292,467,350,693,383.00 |
| Avg Annual Criminal's Income / Savings: ? |
$96,087.01 |
| Recovered Product + Fines & Fees: |
$58,161,030,781,202.23 |
|
Black Market & Grey Market Statistics:
| Guns & Weapons: |
$42,213,276,140,996.58 |
| Drugs and Pharmaceuticals: |
$89,703,211,799,617.73 |
| Extortion & Blackmail: |
$52,766,595,176,245.72 |
| Counterfeit Goods: |
$77,391,006,258,493.73 |
| Trafficking & Intl Sales: |
$33,418,843,611,622.29 |
| Theft & Disappearance: |
$77,391,006,258,493.73 |
| Counterfeit Currency & Instruments : |
$59,802,141,199,745.16 |
| Illegal Mining, Logging, and Hunting : |
$40,454,389,635,121.72 |
| Basic Necessitites : |
$70,355,460,234,994.30 |
| School Loan Fraud : |
$75,632,119,752,618.86 |
| Tax Evasion + Barter Trade : |
$555,760,960,798,154.69 |
|
|
|
Saint Olav Total Market Statistics ?
| National Currency: |
Penning |
| Exchange Rates: |
1 Penning = $1.64 |
| |
$1 = 0.61 Pennings |
| |
Regional Exchange Rates |
| Gross Domestic Product: |
$657,744,000,000,000.00 - 34% |
| Black & Grey Markets Combined: |
$1,292,467,350,693,383.00 - 66% |
| Real Total Economy: |
$1,950,211,350,693,383.00 |
|


