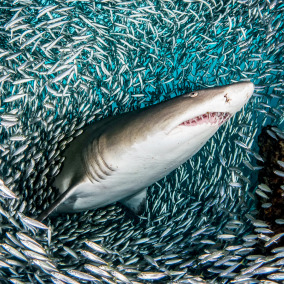
Sand Tiger Shark Domestic Statistics
| Government Category: |
Commonwealth |
| Government Priority: |
Law & Order |
| Economic Rating: |
Good |
| Civil Rights Rating: |
Rare |
| Political Freedoms: |
Average |
| Income Tax Rate: |
38% |
| Consumer Confidence Rate: |
94% |
| Worker Enthusiasm Rate: |
98% |
| Major Industry: |
Information Technology |
| National Animal: |
Sand Tiger Shark |
|
Sand Tiger Shark Demographics
| Total Population: |
6,174,000,000 |
| Criminals: |
672,391,694 |
| Elderly, Disabled, & Retirees: |
786,964,263 |
| Military & Reserves: ? |
254,101,538 |
| Students and Youth: |
1,105,146,000 |
| Unemployed but Able: |
962,607,019 |
| Working Class: |
2,392,789,485 |
|
|
|
Sand Tiger Shark Government Budget Details
| Government Budget: |
$20,446,863,811,915.29 |
| Government Expenditures: |
$19,628,989,259,438.67 |
| Goverment Waste: |
$817,874,552,476.61 |
| Goverment Efficiency: |
96% |
|
Sand Tiger Shark Government Spending Breakdown:
| Administration: |
$1,962,898,925,943.87 |
10% |
| Social Welfare: |
$981,449,462,971.93 |
5% |
| Healthcare: |
$1,962,898,925,943.87 |
10% |
| Education: |
$1,962,898,925,943.87 |
10% |
| Religion & Spirituality: |
$981,449,462,971.93 |
5% |
| Defense: |
$3,140,638,281,510.19 |
16% |
| Law & Order: |
$4,514,667,529,670.89 |
23% |
| Commerce: |
$1,570,319,140,755.09 |
8% |
| Public Transport: |
$1,374,029,248,160.71 |
7% |
| The Environment: |
$588,869,677,783.16 |
3% |
| Social Equality: |
$981,449,462,971.93 |
5% |
|
|
|
Sand Tiger Shark White Market Statistics ?
| Gross Domestic Product: |
$16,152,100,000,000.00 |
| GDP Per Capita: |
$2,616.15 |
| Average Salary Per Employee: |
$4,041.96 |
| Unemployment Rate: |
23.44% |
| Consumption: |
$26,490,002,431,016.96 |
| Exports: |
$5,903,361,736,704.00 |
| Imports: |
$6,133,053,915,136.00 |
| Trade Net: |
-229,692,178,432.00 |
|
Sand Tiger Shark Grey and Black Market Statistics ?
Evasion, Black Market, Barter & Crime
| Black & Grey Markets Combined: |
$51,554,774,369,948.61 |
| Avg Annual Criminal's Income / Savings: ? |
$7,021.40 |
| Recovered Product + Fines & Fees: |
$8,893,198,578,816.14 |
|
Black Market & Grey Market Statistics:
| Guns & Weapons: |
$2,097,349,719,831.55 |
| Drugs and Pharmaceuticals: |
$2,127,746,092,582.73 |
| Extortion & Blackmail: |
$2,188,538,838,085.10 |
| Counterfeit Goods: |
$4,741,834,149,184.37 |
| Trafficking & Intl Sales: |
$1,337,440,401,052.00 |
| Theft & Disappearance: |
$1,823,782,365,070.91 |
| Counterfeit Currency & Instruments : |
$4,985,005,131,193.83 |
| Illegal Mining, Logging, and Hunting : |
$790,305,691,530.73 |
| Basic Necessitites : |
$1,519,818,637,559.09 |
| School Loan Fraud : |
$1,398,233,146,554.37 |
| Tax Evasion + Barter Trade : |
$22,168,552,979,077.90 |
|
|
|
Sand Tiger Shark Total Market Statistics ?
| National Currency: |
Apexia |
| Exchange Rates: |
1 Apexia = $0.22 |
| |
$1 = 4.54 Apexias |
| |
Regional Exchange Rates |
| Gross Domestic Product: |
$16,152,100,000,000.00 - 24% |
| Black & Grey Markets Combined: |
$51,554,774,369,948.61 - 76% |
| Real Total Economy: |
$67,706,874,369,948.61 |
|


