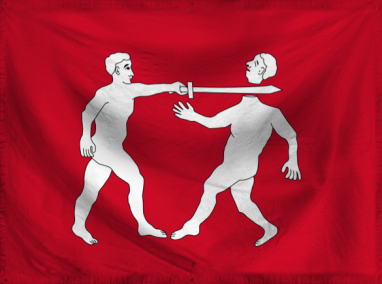
Santa Dystopia Domestic Statistics
| Government Category: |
Democratic People's Republic |
| Government Priority: |
Defence |
| Economic Rating: |
Frightening |
| Civil Rights Rating: |
Average |
| Political Freedoms: |
Rare |
| Income Tax Rate: |
70% |
| Consumer Confidence Rate: |
104% |
| Worker Enthusiasm Rate: |
101% |
| Major Industry: |
Arms Manufacturing |
| National Animal: |
lizard |
|
Santa Dystopia Demographics
| Total Population: |
12,384,000,000 |
| Criminals: |
827,022,091 |
| Elderly, Disabled, & Retirees: |
1,172,184,934 |
| Military & Reserves: ? |
1,130,136,671 |
| Students and Youth: |
2,588,256,000 |
| Unemployed but Able: |
1,517,999,911 |
| Working Class: |
5,148,400,392 |
|
|
|
Santa Dystopia Government Budget Details
| Government Budget: |
$340,732,843,481,943.25 |
| Government Expenditures: |
$306,659,559,133,748.94 |
| Goverment Waste: |
$34,073,284,348,194.31 |
| Goverment Efficiency: |
90% |
|
Santa Dystopia Government Spending Breakdown:
| Administration: |
$27,599,360,322,037.40 |
9% |
| Social Welfare: |
$0.00 |
0% |
| Healthcare: |
$36,799,147,096,049.88 |
12% |
| Education: |
$42,932,338,278,724.85 |
14% |
| Religion & Spirituality: |
$0.00 |
0% |
| Defense: |
$91,997,867,740,124.67 |
30% |
| Law & Order: |
$42,932,338,278,724.85 |
14% |
| Commerce: |
$58,265,316,235,412.30 |
19% |
| Public Transport: |
$9,199,786,774,012.47 |
3% |
| The Environment: |
$0.00 |
0% |
| Social Equality: |
$0.00 |
0% |
|
|
|
Santa Dystopia White Market Statistics ?
| Gross Domestic Product: |
$247,399,000,000,000.00 |
| GDP Per Capita: |
$19,977.31 |
| Average Salary Per Employee: |
$32,809.05 |
| Unemployment Rate: |
9.47% |
| Consumption: |
$136,964,262,277,939.19 |
| Exports: |
$57,978,956,808,192.00 |
| Imports: |
$53,323,285,659,648.00 |
| Trade Net: |
4,655,671,148,544.00 |
|
Santa Dystopia Grey and Black Market Statistics ?
Evasion, Black Market, Barter & Crime
| Black & Grey Markets Combined: |
$1,009,073,117,513,185.25 |
| Avg Annual Criminal's Income / Savings: ? |
$118,229.49 |
| Recovered Product + Fines & Fees: |
$105,952,677,338,884.47 |
|
Black Market & Grey Market Statistics:
| Guns & Weapons: |
$77,216,797,634,902.70 |
| Drugs and Pharmaceuticals: |
$48,903,971,835,438.38 |
| Extortion & Blackmail: |
$72,069,011,125,909.20 |
| Counterfeit Goods: |
$123,546,876,215,844.34 |
| Trafficking & Intl Sales: |
$7,721,679,763,490.27 |
| Theft & Disappearance: |
$30,886,719,053,961.09 |
| Counterfeit Currency & Instruments : |
$97,807,943,670,876.77 |
| Illegal Mining, Logging, and Hunting : |
$3,860,839,881,745.14 |
| Basic Necessitites : |
$18,017,252,781,477.30 |
| School Loan Fraud : |
$36,034,505,562,954.60 |
| Tax Evasion + Barter Trade : |
$433,901,440,530,669.62 |
|
|
|
Santa Dystopia Total Market Statistics ?
| National Currency: |
shilling |
| Exchange Rates: |
1 shilling = $1.32 |
| |
$1 = 0.76 shillings |
| |
Regional Exchange Rates |
| Gross Domestic Product: |
$247,399,000,000,000.00 - 20% |
| Black & Grey Markets Combined: |
$1,009,073,117,513,185.25 - 80% |
| Real Total Economy: |
$1,256,472,117,513,185.25 |
|


