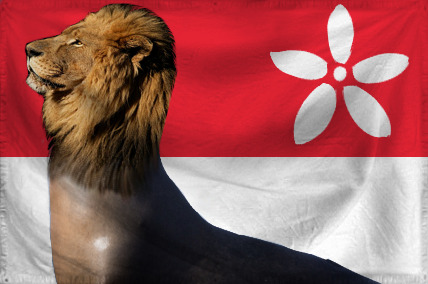
Sea Lions Domestic Statistics
| Government Category: |
Republic |
| Government Priority: |
Administration |
| Economic Rating: |
All-Consuming |
| Civil Rights Rating: |
Very Good |
| Political Freedoms: |
Very Good |
| Income Tax Rate: |
62% |
| Consumer Confidence Rate: |
105% |
| Worker Enthusiasm Rate: |
107% |
| Major Industry: |
Information Technology |
| National Animal: |
Sea Lion |
|
Sea Lions Demographics
| Total Population: |
7,215,000,000 |
| Criminals: |
452,036,446 |
| Elderly, Disabled, & Retirees: |
713,268,582 |
| Military & Reserves: ? |
197,068,246 |
| Students and Youth: |
1,512,264,000 |
| Unemployed but Able: |
888,019,014 |
| Working Class: |
3,452,343,712 |
|
|
|
Sea Lions Government Budget Details
| Government Budget: |
$177,725,140,404,094.91 |
| Government Expenditures: |
$172,393,386,191,972.06 |
| Goverment Waste: |
$5,331,754,212,122.84 |
| Goverment Efficiency: |
97% |
|
Sea Lions Government Spending Breakdown:
| Administration: |
$29,306,875,652,635.25 |
17% |
| Social Welfare: |
$10,343,603,171,518.32 |
6% |
| Healthcare: |
$22,411,140,204,956.37 |
13% |
| Education: |
$27,582,941,790,715.53 |
16% |
| Religion & Spirituality: |
$0.00 |
0% |
| Defense: |
$15,515,404,757,277.48 |
9% |
| Law & Order: |
$3,447,867,723,839.44 |
2% |
| Commerce: |
$18,963,272,481,116.93 |
11% |
| Public Transport: |
$5,171,801,585,759.16 |
3% |
| The Environment: |
$24,135,074,066,876.09 |
14% |
| Social Equality: |
$8,619,669,309,598.60 |
5% |
|
|
|
Sea Lions White Market Statistics ?
| Gross Domestic Product: |
$141,573,000,000,000.00 |
| GDP Per Capita: |
$19,622.04 |
| Average Salary Per Employee: |
$29,946.97 |
| Unemployment Rate: |
9.68% |
| Consumption: |
$92,616,271,111,127.05 |
| Exports: |
$30,951,954,776,064.00 |
| Imports: |
$31,550,406,131,712.00 |
| Trade Net: |
-598,451,355,648.00 |
|
Sea Lions Grey and Black Market Statistics ?
Evasion, Black Market, Barter & Crime
| Black & Grey Markets Combined: |
$235,125,839,007,931.81 |
| Avg Annual Criminal's Income / Savings: ? |
$36,424.93 |
| Recovered Product + Fines & Fees: |
$3,526,887,585,118.98 |
|
Black Market & Grey Market Statistics:
| Guns & Weapons: |
$5,940,513,103,995.15 |
| Drugs and Pharmaceuticals: |
$13,861,197,242,655.35 |
| Extortion & Blackmail: |
$18,481,596,323,540.46 |
| Counterfeit Goods: |
$11,550,997,702,212.79 |
| Trafficking & Intl Sales: |
$6,600,570,115,550.17 |
| Theft & Disappearance: |
$11,881,026,207,990.30 |
| Counterfeit Currency & Instruments : |
$15,511,339,771,542.89 |
| Illegal Mining, Logging, and Hunting : |
$10,230,883,679,102.76 |
| Basic Necessitites : |
$10,890,940,690,657.77 |
| School Loan Fraud : |
$15,181,311,265,765.38 |
| Tax Evasion + Barter Trade : |
$101,104,110,773,410.67 |
|
|
|
Sea Lions Total Market Statistics ?
| National Currency: |
Sand Dollar |
| Exchange Rates: |
1 Sand Dollar = $1.21 |
| |
$1 = 0.83 Sand Dollars |
| |
Regional Exchange Rates |
| Gross Domestic Product: |
$141,573,000,000,000.00 - 38% |
| Black & Grey Markets Combined: |
$235,125,839,007,931.81 - 62% |
| Real Total Economy: |
$376,698,839,007,931.81 |
|


