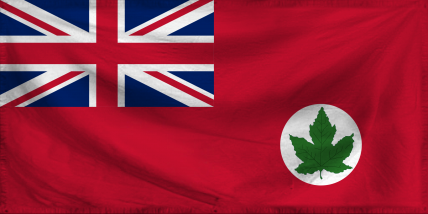
Shale on Tral Domestic Statistics
| Government Category: |
Colony |
| Government Priority: |
Defence |
| Economic Rating: |
Powerhouse |
| Civil Rights Rating: |
Some |
| Political Freedoms: |
World Benchmark |
| Income Tax Rate: |
14% |
| Consumer Confidence Rate: |
100% |
| Worker Enthusiasm Rate: |
104% |
| Major Industry: |
Gambling |
| National Animal: |
Tralan Crow |
|
Shale on Tral Demographics
| Total Population: |
132,000,000 |
| Criminals: |
12,620,738 |
| Elderly, Disabled, & Retirees: |
19,213,326 |
| Military & Reserves: ? |
8,480,252 |
| Students and Youth: |
21,674,400 |
| Unemployed but Able: |
19,600,898 |
| Working Class: |
50,410,386 |
|
|
|
Shale on Tral Government Budget Details
| Government Budget: |
$904,304,285,177.61 |
| Government Expenditures: |
$895,261,242,325.83 |
| Goverment Waste: |
$9,043,042,851.78 |
| Goverment Efficiency: |
99% |
|
Shale on Tral Government Spending Breakdown:
| Administration: |
$125,336,573,925.62 |
14% |
| Social Welfare: |
$44,763,062,116.29 |
5% |
| Healthcare: |
$98,478,736,655.84 |
11% |
| Education: |
$53,715,674,539.55 |
6% |
| Religion & Spirituality: |
$0.00 |
0% |
| Defense: |
$214,862,698,158.20 |
24% |
| Law & Order: |
$152,194,411,195.39 |
17% |
| Commerce: |
$98,478,736,655.84 |
11% |
| Public Transport: |
$44,763,062,116.29 |
5% |
| The Environment: |
$0.00 |
0% |
| Social Equality: |
$80,573,511,809.33 |
9% |
|
|
|
Shale on Tral White Market Statistics ?
| Gross Domestic Product: |
$763,387,000,000.00 |
| GDP Per Capita: |
$5,783.23 |
| Average Salary Per Employee: |
$10,236.97 |
| Unemployment Rate: |
20.33% |
| Consumption: |
$2,953,222,773,800.96 |
| Exports: |
$445,343,678,464.00 |
| Imports: |
$481,066,811,392.00 |
| Trade Net: |
-35,723,132,928.00 |
|
Shale on Tral Grey and Black Market Statistics ?
Evasion, Black Market, Barter & Crime
| Black & Grey Markets Combined: |
$730,747,905,559.19 |
| Avg Annual Criminal's Income / Savings: ? |
$5,421.40 |
| Recovered Product + Fines & Fees: |
$93,170,357,958.80 |
|
Black Market & Grey Market Statistics:
| Guns & Weapons: |
$43,610,304,255.87 |
| Drugs and Pharmaceuticals: |
$25,439,344,149.26 |
| Extortion & Blackmail: |
$45,427,400,266.53 |
| Counterfeit Goods: |
$72,683,840,426.44 |
| Trafficking & Intl Sales: |
$9,085,480,053.31 |
| Theft & Disappearance: |
$36,341,920,213.22 |
| Counterfeit Currency & Instruments : |
$78,135,128,458.43 |
| Illegal Mining, Logging, and Hunting : |
$4,542,740,026.65 |
| Basic Necessitites : |
$22,713,700,133.26 |
| School Loan Fraud : |
$10,902,576,063.97 |
| Tax Evasion + Barter Trade : |
$314,221,599,390.45 |
|
|
|
Shale on Tral Total Market Statistics ?
| National Currency: |
Canadian Dollar |
| Exchange Rates: |
1 Canadian Dollar = $0.60 |
| |
$1 = 1.67 Canadian Dollars |
| |
Regional Exchange Rates |
| Gross Domestic Product: |
$763,387,000,000.00 - 51% |
| Black & Grey Markets Combined: |
$730,747,905,559.19 - 49% |
| Real Total Economy: |
$1,494,134,905,559.19 |
|


