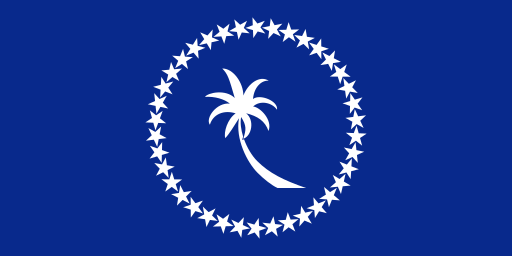
Slater Islands Domestic Statistics
| Government Category: |
Empire |
| Government Priority: |
Administration |
| Economic Rating: |
Fair |
| Civil Rights Rating: |
Below Average |
| Political Freedoms: |
Excellent |
| Income Tax Rate: |
32% |
| Consumer Confidence Rate: |
98% |
| Worker Enthusiasm Rate: |
101% |
| Major Industry: |
Uranium Mining |
| National Animal: |
Monkey |
|
Slater Islands Demographics
| Total Population: |
619,000,000 |
| Criminals: |
68,610,185 |
| Elderly, Disabled, & Retirees: |
77,157,450 |
| Military & Reserves: ? |
12,524,898 |
| Students and Youth: |
113,896,000 |
| Unemployed but Able: |
98,400,986 |
| Working Class: |
248,410,481 |
|
|
|
Slater Islands Government Budget Details
| Government Budget: |
$1,065,831,608,207.28 |
| Government Expenditures: |
$1,044,514,976,043.13 |
| Goverment Waste: |
$21,316,632,164.15 |
| Goverment Efficiency: |
98% |
|
Slater Islands Government Spending Breakdown:
| Administration: |
$208,902,995,208.63 |
20% |
| Social Welfare: |
$73,116,048,323.02 |
7% |
| Healthcare: |
$114,896,647,364.75 |
11% |
| Education: |
$156,677,246,406.47 |
15% |
| Religion & Spirituality: |
$94,006,347,843.88 |
9% |
| Defense: |
$83,561,198,083.45 |
8% |
| Law & Order: |
$94,006,347,843.88 |
9% |
| Commerce: |
$41,780,599,041.73 |
4% |
| Public Transport: |
$62,670,898,562.59 |
6% |
| The Environment: |
$41,780,599,041.73 |
4% |
| Social Equality: |
$52,225,748,802.16 |
5% |
|
|
|
Slater Islands White Market Statistics ?
| Gross Domestic Product: |
$855,273,000,000.00 |
| GDP Per Capita: |
$1,381.70 |
| Average Salary Per Employee: |
$2,215.11 |
| Unemployment Rate: |
24.72% |
| Consumption: |
$1,668,486,466,109.44 |
| Exports: |
$313,846,720,512.00 |
| Imports: |
$346,055,114,752.00 |
| Trade Net: |
-32,208,394,240.00 |
|
Slater Islands Grey and Black Market Statistics ?
Evasion, Black Market, Barter & Crime
| Black & Grey Markets Combined: |
$2,400,619,970,644.63 |
| Avg Annual Criminal's Income / Savings: ? |
$2,580.33 |
| Recovered Product + Fines & Fees: |
$162,041,848,018.51 |
|
Black Market & Grey Market Statistics:
| Guns & Weapons: |
$65,394,463,407.22 |
| Drugs and Pharmaceuticals: |
$146,738,795,938.14 |
| Extortion & Blackmail: |
$153,118,743,587.63 |
| Counterfeit Goods: |
$108,459,110,041.24 |
| Trafficking & Intl Sales: |
$79,749,345,618.56 |
| Theft & Disappearance: |
$102,079,162,391.75 |
| Counterfeit Currency & Instruments : |
$210,538,272,432.99 |
| Illegal Mining, Logging, and Hunting : |
$44,659,633,546.39 |
| Basic Necessitites : |
$108,459,110,041.24 |
| School Loan Fraud : |
$108,459,110,041.24 |
| Tax Evasion + Barter Trade : |
$1,032,266,587,377.19 |
|
|
|
Slater Islands Total Market Statistics ?
| National Currency: |
dollar |
| Exchange Rates: |
1 dollar = $0.12 |
| |
$1 = 8.55 dollars |
| |
Regional Exchange Rates |
| Gross Domestic Product: |
$855,273,000,000.00 - 26% |
| Black & Grey Markets Combined: |
$2,400,619,970,644.63 - 74% |
| Real Total Economy: |
$3,255,892,970,644.63 |
|