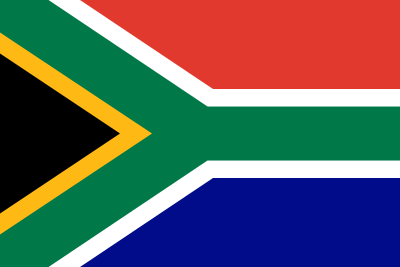
Southern African Regime Domestic Statistics
| Government Category: |
Dictatorship |
| Government Priority: |
Law & Order |
| Economic Rating: |
Weak |
| Civil Rights Rating: |
Rare |
| Political Freedoms: |
Outlawed |
| Income Tax Rate: |
54% |
| Consumer Confidence Rate: |
92% |
| Worker Enthusiasm Rate: |
91% |
| Major Industry: |
Trout Farming |
| National Animal: |
Cobra |
|
Southern African Regime Demographics
| Total Population: |
62,000,000 |
| Criminals: |
8,640,140 |
| Elderly, Disabled, & Retirees: |
5,953,577 |
| Military & Reserves: ? |
1,859,270 |
| Students and Youth: |
11,594,000 |
| Unemployed but Able: |
9,989,084 |
| Working Class: |
23,963,928 |
|
|
|
Southern African Regime Government Budget Details
| Government Budget: |
$54,508,607,343.82 |
| Government Expenditures: |
$43,606,885,875.06 |
| Goverment Waste: |
$10,901,721,468.76 |
| Goverment Efficiency: |
80% |
|
Southern African Regime Government Spending Breakdown:
| Administration: |
$3,924,619,728.76 |
9% |
| Social Welfare: |
$5,232,826,305.01 |
12% |
| Healthcare: |
$4,796,757,446.26 |
11% |
| Education: |
$4,360,688,587.51 |
10% |
| Religion & Spirituality: |
$872,137,717.50 |
2% |
| Defense: |
$5,232,826,305.01 |
12% |
| Law & Order: |
$6,104,964,022.51 |
14% |
| Commerce: |
$2,616,413,152.50 |
6% |
| Public Transport: |
$3,488,550,870.00 |
8% |
| The Environment: |
$2,616,413,152.50 |
6% |
| Social Equality: |
$2,616,413,152.50 |
6% |
|
|
|
Southern African Regime White Market Statistics ?
| Gross Domestic Product: |
$33,196,700,000.00 |
| GDP Per Capita: |
$535.43 |
| Average Salary Per Employee: |
$753.84 |
| Unemployment Rate: |
25.62% |
| Consumption: |
$47,869,338,255.36 |
| Exports: |
$13,258,022,400.00 |
| Imports: |
$12,429,332,480.00 |
| Trade Net: |
828,689,920.00 |
|
Southern African Regime Grey and Black Market Statistics ?
Evasion, Black Market, Barter & Crime
| Black & Grey Markets Combined: |
$203,202,088,406.32 |
| Avg Annual Criminal's Income / Savings: ? |
$1,884.49 |
| Recovered Product + Fines & Fees: |
$21,336,219,282.66 |
|
Black Market & Grey Market Statistics:
| Guns & Weapons: |
$6,478,971,587.53 |
| Drugs and Pharmaceuticals: |
$8,811,401,359.04 |
| Extortion & Blackmail: |
$7,774,765,905.04 |
| Counterfeit Goods: |
$13,476,260,902.06 |
| Trafficking & Intl Sales: |
$6,219,812,724.03 |
| Theft & Disappearance: |
$8,811,401,359.04 |
| Counterfeit Currency & Instruments : |
$15,031,214,083.07 |
| Illegal Mining, Logging, and Hunting : |
$5,183,177,270.02 |
| Basic Necessitites : |
$10,366,354,540.05 |
| School Loan Fraud : |
$6,738,130,451.03 |
| Tax Evasion + Barter Trade : |
$87,376,898,014.72 |
|
|
|
Southern African Regime Total Market Statistics ?
| National Currency: |
Rand |
| Exchange Rates: |
1 Rand = $0.05 |
| |
$1 = 19.42 Rands |
| |
Regional Exchange Rates |
| Gross Domestic Product: |
$33,196,700,000.00 - 14% |
| Black & Grey Markets Combined: |
$203,202,088,406.32 - 86% |
| Real Total Economy: |
$236,398,788,406.32 |
|