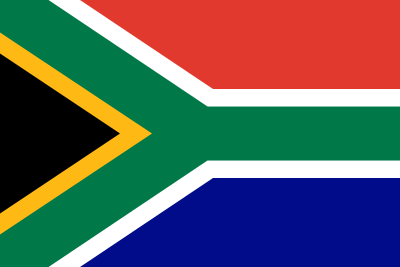
Southern Colonies Domestic Statistics
| Government Category: |
Federation |
| Government Priority: |
Defence |
| Economic Rating: |
Weak |
| Civil Rights Rating: |
Outlawed |
| Political Freedoms: |
Outlawed |
| Income Tax Rate: |
74% |
| Consumer Confidence Rate: |
88% |
| Worker Enthusiasm Rate: |
87% |
| Major Industry: |
Arms Manufacturing |
| National Animal: |
Elephant |
|
Southern Colonies Demographics
| Total Population: |
3,115,000,000 |
| Criminals: |
433,078,254 |
| Elderly, Disabled, & Retirees: |
337,317,079 |
| Military & Reserves: ? |
264,964,016 |
| Students and Youth: |
544,502,000 |
| Unemployed but Able: |
501,259,453 |
| Working Class: |
1,033,879,198 |
|
|
|
Southern Colonies Government Budget Details
| Government Budget: |
$3,253,614,555,640.63 |
| Government Expenditures: |
$2,602,891,644,512.50 |
| Goverment Waste: |
$650,722,911,128.13 |
| Goverment Efficiency: |
80% |
|
Southern Colonies Government Spending Breakdown:
| Administration: |
$104,115,665,780.50 |
4% |
| Social Welfare: |
$0.00 |
0% |
| Healthcare: |
$208,231,331,561.00 |
8% |
| Education: |
$104,115,665,780.50 |
4% |
| Religion & Spirituality: |
$286,318,080,896.38 |
11% |
| Defense: |
$884,983,159,134.25 |
34% |
| Law & Order: |
$572,636,161,792.75 |
22% |
| Commerce: |
$156,173,498,670.75 |
6% |
| Public Transport: |
$52,057,832,890.25 |
2% |
| The Environment: |
$130,144,582,225.63 |
5% |
| Social Equality: |
$78,086,749,335.38 |
3% |
|
|
|
Southern Colonies White Market Statistics ?
| Gross Domestic Product: |
$1,906,770,000,000.00 |
| GDP Per Capita: |
$612.13 |
| Average Salary Per Employee: |
$917.79 |
| Unemployment Rate: |
25.54% |
| Consumption: |
$1,244,395,093,360.64 |
| Exports: |
$558,749,524,992.00 |
| Imports: |
$546,522,267,648.00 |
| Trade Net: |
12,227,257,344.00 |
|
Southern Colonies Grey and Black Market Statistics ?
Evasion, Black Market, Barter & Crime
| Black & Grey Markets Combined: |
$13,150,981,315,022.34 |
| Avg Annual Criminal's Income / Savings: ? |
$3,419.63 |
| Recovered Product + Fines & Fees: |
$2,169,911,916,978.69 |
|
Black Market & Grey Market Statistics:
| Guns & Weapons: |
$1,150,129,756,077.60 |
| Drugs and Pharmaceuticals: |
$485,088,740,658.58 |
| Extortion & Blackmail: |
$312,960,477,844.24 |
| Counterfeit Goods: |
$1,408,322,150,299.10 |
| Trafficking & Intl Sales: |
$312,960,477,844.24 |
| Theft & Disappearance: |
$344,256,525,628.67 |
| Counterfeit Currency & Instruments : |
$1,345,730,054,730.25 |
| Illegal Mining, Logging, and Hunting : |
$187,776,286,706.55 |
| Basic Necessitites : |
$109,536,167,245.49 |
| School Loan Fraud : |
$203,424,310,598.76 |
| Tax Evasion + Barter Trade : |
$5,654,921,965,459.61 |
|
|
|
Southern Colonies Total Market Statistics ?
| National Currency: |
Rand |
| Exchange Rates: |
1 Rand = $0.06 |
| |
$1 = 18.17 Rands |
| |
Regional Exchange Rates |
| Gross Domestic Product: |
$1,906,770,000,000.00 - 13% |
| Black & Grey Markets Combined: |
$13,150,981,315,022.34 - 87% |
| Real Total Economy: |
$15,057,751,315,022.34 |
|