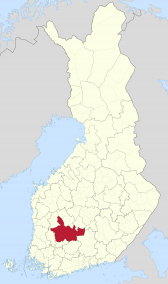
Tampere sub-region Domestic Statistics
| Government Category: |
Colony |
| Government Priority: |
Defence |
| Economic Rating: |
Frightening |
| Civil Rights Rating: |
Unheard Of |
| Political Freedoms: |
Few |
| Income Tax Rate: |
70% |
| Consumer Confidence Rate: |
96% |
| Worker Enthusiasm Rate: |
97% |
| Major Industry: |
Arms Manufacturing |
| National Animal: |
kangaroo |
|
Tampere sub-region Demographics
| Total Population: |
3,896,000,000 |
| Criminals: |
269,878,151 |
| Elderly, Disabled, & Retirees: |
414,260,061 |
| Military & Reserves: ? |
222,339,884 |
| Students and Youth: |
773,356,000 |
| Unemployed but Able: |
488,155,924 |
| Working Class: |
1,728,009,979 |
|
|
|
Tampere sub-region Government Budget Details
| Government Budget: |
$96,098,332,169,071.48 |
| Government Expenditures: |
$88,410,465,595,545.77 |
| Goverment Waste: |
$7,687,866,573,525.72 |
| Goverment Efficiency: |
92% |
|
Tampere sub-region Government Spending Breakdown:
| Administration: |
$12,377,465,183,376.41 |
14% |
| Social Welfare: |
$1,768,209,311,910.92 |
2% |
| Healthcare: |
$8,841,046,559,554.58 |
10% |
| Education: |
$9,725,151,215,510.04 |
11% |
| Religion & Spirituality: |
$0.00 |
0% |
| Defense: |
$16,797,988,463,153.70 |
19% |
| Law & Order: |
$15,029,779,151,242.78 |
17% |
| Commerce: |
$11,493,360,527,420.95 |
13% |
| Public Transport: |
$2,652,313,967,866.37 |
3% |
| The Environment: |
$6,188,732,591,688.20 |
7% |
| Social Equality: |
$3,536,418,623,821.83 |
4% |
|
|
|
Tampere sub-region White Market Statistics ?
| Gross Domestic Product: |
$70,566,200,000,000.00 |
| GDP Per Capita: |
$18,112.47 |
| Average Salary Per Employee: |
$24,717.63 |
| Unemployment Rate: |
10.61% |
| Consumption: |
$38,203,489,989,427.20 |
| Exports: |
$16,471,159,400,448.00 |
| Imports: |
$16,487,174,635,520.00 |
| Trade Net: |
-16,015,235,072.00 |
|
Tampere sub-region Grey and Black Market Statistics ?
Evasion, Black Market, Barter & Crime
| Black & Grey Markets Combined: |
$289,187,266,495,620.88 |
| Avg Annual Criminal's Income / Savings: ? |
$94,995.35 |
| Recovered Product + Fines & Fees: |
$36,871,376,478,191.66 |
|
Black Market & Grey Market Statistics:
| Guns & Weapons: |
$13,662,905,444,443.79 |
| Drugs and Pharmaceuticals: |
$11,146,054,441,519.94 |
| Extortion & Blackmail: |
$19,415,707,736,841.18 |
| Counterfeit Goods: |
$28,404,461,318,712.09 |
| Trafficking & Intl Sales: |
$4,674,151,862,572.88 |
| Theft & Disappearance: |
$10,067,404,011,695.43 |
| Counterfeit Currency & Instruments : |
$29,123,561,605,261.77 |
| Illegal Mining, Logging, and Hunting : |
$6,112,352,435,672.22 |
| Basic Necessitites : |
$6,831,452,722,221.90 |
| School Loan Fraud : |
$10,426,954,154,970.26 |
| Tax Evasion + Barter Trade : |
$124,350,524,593,116.97 |
|
|
|
Tampere sub-region Total Market Statistics ?
| National Currency: |
rupee |
| Exchange Rates: |
1 rupee = $1.25 |
| |
$1 = 0.80 rupees |
| |
Regional Exchange Rates |
| Gross Domestic Product: |
$70,566,200,000,000.00 - 20% |
| Black & Grey Markets Combined: |
$289,187,266,495,620.88 - 80% |
| Real Total Economy: |
$359,753,466,495,620.88 |
|


