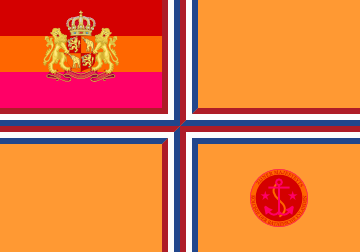
The Batavian Islands Domestic Statistics
| Government Category: |
His Majesty's Colony |
| Government Priority: |
Defence |
| Economic Rating: |
Thriving |
| Civil Rights Rating: |
Good |
| Political Freedoms: |
Average |
| Income Tax Rate: |
19% |
| Consumer Confidence Rate: |
103% |
| Worker Enthusiasm Rate: |
105% |
| Major Industry: |
Woodchip Exports |
| National Animal: |
elephant |
|
The Batavian Islands Demographics
| Total Population: |
24,517,000,000 |
| Criminals: |
2,448,384,086 |
| Elderly, Disabled, & Retirees: |
3,201,439,569 |
| Military & Reserves: ? |
1,110,331,481 |
| Students and Youth: |
4,318,669,550 |
| Unemployed but Able: |
3,662,904,042 |
| Working Class: |
9,775,271,273 |
|
|
|
The Batavian Islands Government Budget Details
| Government Budget: |
$162,651,008,269,119.66 |
| Government Expenditures: |
$156,144,967,938,354.88 |
| Goverment Waste: |
$6,506,040,330,764.78 |
| Goverment Efficiency: |
96% |
|
The Batavian Islands Government Spending Breakdown:
| Administration: |
$4,684,349,038,150.65 |
3% |
| Social Welfare: |
$18,737,396,152,602.59 |
12% |
| Healthcare: |
$18,737,396,152,602.59 |
12% |
| Education: |
$26,544,644,549,520.33 |
17% |
| Religion & Spirituality: |
$1,561,449,679,383.55 |
1% |
| Defense: |
$26,544,644,549,520.33 |
17% |
| Law & Order: |
$24,983,194,870,136.78 |
16% |
| Commerce: |
$17,175,946,473,219.04 |
11% |
| Public Transport: |
$1,561,449,679,383.55 |
1% |
| The Environment: |
$0.00 |
0% |
| Social Equality: |
$9,368,698,076,301.29 |
6% |
|
|
|
The Batavian Islands White Market Statistics ?
| Gross Domestic Product: |
$131,909,000,000,000.00 |
| GDP Per Capita: |
$5,380.31 |
| Average Salary Per Employee: |
$9,486.05 |
| Unemployment Rate: |
20.71% |
| Consumption: |
$429,872,476,827,156.50 |
| Exports: |
$67,050,698,702,848.00 |
| Imports: |
$71,119,809,806,336.00 |
| Trade Net: |
-4,069,111,103,488.00 |
|
The Batavian Islands Grey and Black Market Statistics ?
Evasion, Black Market, Barter & Crime
| Black & Grey Markets Combined: |
$159,244,284,252,828.59 |
| Avg Annual Criminal's Income / Savings: ? |
$5,587.68 |
| Recovered Product + Fines & Fees: |
$19,109,314,110,339.43 |
|
Black Market & Grey Market Statistics:
| Guns & Weapons: |
$6,889,385,469,630.12 |
| Drugs and Pharmaceuticals: |
$8,387,077,963,027.98 |
| Extortion & Blackmail: |
$5,591,385,308,685.32 |
| Counterfeit Goods: |
$14,178,155,604,166.34 |
| Trafficking & Intl Sales: |
$599,076,997,359.14 |
| Theft & Disappearance: |
$7,188,923,968,309.69 |
| Counterfeit Currency & Instruments : |
$10,983,078,284,917.59 |
| Illegal Mining, Logging, and Hunting : |
$199,692,332,453.05 |
| Basic Necessitites : |
$9,385,539,625,293.21 |
| School Loan Fraud : |
$6,789,539,303,403.60 |
| Tax Evasion + Barter Trade : |
$68,475,042,228,716.30 |
|
|
|
The Batavian Islands Total Market Statistics ?
| National Currency: |
guilder |
| Exchange Rates: |
1 guilder = $0.52 |
| |
$1 = 1.94 guilders |
| |
Regional Exchange Rates |
| Gross Domestic Product: |
$131,909,000,000,000.00 - 45% |
| Black & Grey Markets Combined: |
$159,244,284,252,828.59 - 55% |
| Real Total Economy: |
$291,153,284,252,828.62 |
|


