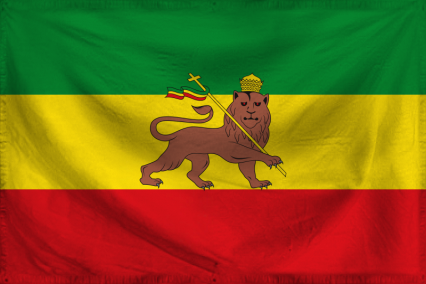
The Ethiopian Empire Domestic Statistics
| Government Category: |
Solomonic Dynasty |
| Government Priority: |
Defence |
| Economic Rating: |
Good |
| Civil Rights Rating: |
Good |
| Political Freedoms: |
Excellent |
| Income Tax Rate: |
28% |
| Consumer Confidence Rate: |
101% |
| Worker Enthusiasm Rate: |
104% |
| Major Industry: |
Uranium Mining |
| National Animal: |
lion |
|
The Ethiopian Empire Demographics
| Total Population: |
6,114,000,000 |
| Criminals: |
653,540,681 |
| Elderly, Disabled, & Retirees: |
814,904,009 |
| Military & Reserves: ? |
235,707,508 |
| Students and Youth: |
1,072,395,600 |
| Unemployed but Able: |
954,187,400 |
| Working Class: |
2,383,264,801 |
|
|
|
The Ethiopian Empire Government Budget Details
| Government Budget: |
$19,233,695,223,754.26 |
| Government Expenditures: |
$18,849,021,319,279.18 |
| Goverment Waste: |
$384,673,904,475.09 |
| Goverment Efficiency: |
98% |
|
The Ethiopian Empire Government Spending Breakdown:
| Administration: |
$1,319,431,492,349.54 |
7% |
| Social Welfare: |
$2,827,353,197,891.88 |
15% |
| Healthcare: |
$1,884,902,131,927.92 |
10% |
| Education: |
$2,073,392,345,120.71 |
11% |
| Religion & Spirituality: |
$1,884,902,131,927.92 |
10% |
| Defense: |
$2,827,353,197,891.88 |
15% |
| Law & Order: |
$2,638,862,984,699.09 |
14% |
| Commerce: |
$188,490,213,192.79 |
1% |
| Public Transport: |
$1,319,431,492,349.54 |
7% |
| The Environment: |
$565,470,639,578.38 |
3% |
| Social Equality: |
$753,960,852,771.17 |
4% |
|
|
|
The Ethiopian Empire White Market Statistics ?
| Gross Domestic Product: |
$15,611,800,000,000.00 |
| GDP Per Capita: |
$2,553.45 |
| Average Salary Per Employee: |
$4,472.48 |
| Unemployment Rate: |
23.51% |
| Consumption: |
$34,719,602,269,224.96 |
| Exports: |
$6,093,130,956,800.00 |
| Imports: |
$6,629,952,061,440.00 |
| Trade Net: |
-536,821,104,640.00 |
|
The Ethiopian Empire Grey and Black Market Statistics ?
Evasion, Black Market, Barter & Crime
| Black & Grey Markets Combined: |
$20,765,454,887,666.15 |
| Avg Annual Criminal's Income / Savings: ? |
$2,621.60 |
| Recovered Product + Fines & Fees: |
$2,180,372,763,204.95 |
|
Black Market & Grey Market Statistics:
| Guns & Weapons: |
$926,930,970,957.50 |
| Drugs and Pharmaceuticals: |
$1,085,833,423,121.65 |
| Extortion & Blackmail: |
$423,739,872,437.72 |
| Counterfeit Goods: |
$1,191,768,391,231.07 |
| Trafficking & Intl Sales: |
$715,061,034,738.65 |
| Theft & Disappearance: |
$741,544,776,766.00 |
| Counterfeit Currency & Instruments : |
$1,509,573,295,559.36 |
| Illegal Mining, Logging, and Hunting : |
$344,288,646,355.64 |
| Basic Necessitites : |
$1,191,768,391,231.07 |
| School Loan Fraud : |
$662,093,550,683.93 |
| Tax Evasion + Barter Trade : |
$8,929,145,601,696.45 |
|
|
|
The Ethiopian Empire Total Market Statistics ?
| National Currency: |
birr |
| Exchange Rates: |
1 birr = $0.22 |
| |
$1 = 4.59 birrs |
| |
Regional Exchange Rates |
| Gross Domestic Product: |
$15,611,800,000,000.00 - 43% |
| Black & Grey Markets Combined: |
$20,765,454,887,666.15 - 57% |
| Real Total Economy: |
$36,377,254,887,666.16 |
|


