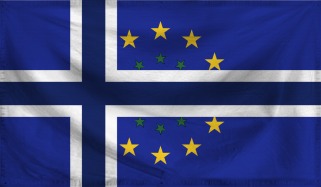
The Iron Lions Domestic Statistics
| Government Category: |
Allied States |
| Government Priority: |
Defence |
| Economic Rating: |
Frightening |
| Civil Rights Rating: |
Some |
| Political Freedoms: |
Few |
| Income Tax Rate: |
99% |
| Consumer Confidence Rate: |
102% |
| Worker Enthusiasm Rate: |
101% |
| Major Industry: |
Arms Manufacturing |
| National Animal: |
Arctic lion |
|
The Iron Lions Demographics
| Total Population: |
18,783,000,000 |
| Criminals: |
988,366,259 |
| Elderly, Disabled, & Retirees: |
1,161,597,301 |
| Military & Reserves: ? |
1,129,684,342 |
| Students and Youth: |
4,585,869,450 |
| Unemployed but Able: |
2,137,655,219 |
| Working Class: |
8,779,827,430 |
|
|
|
The Iron Lions Government Budget Details
| Government Budget: |
$698,890,787,132,738.25 |
| Government Expenditures: |
$642,979,524,162,119.25 |
| Goverment Waste: |
$55,911,262,970,619.00 |
| Goverment Efficiency: |
92% |
|
The Iron Lions Government Spending Breakdown:
| Administration: |
$57,868,157,174,590.73 |
9% |
| Social Welfare: |
$12,859,590,483,242.38 |
2% |
| Healthcare: |
$83,587,338,141,075.50 |
13% |
| Education: |
$109,306,519,107,560.28 |
17% |
| Religion & Spirituality: |
$0.00 |
0% |
| Defense: |
$122,166,109,590,802.66 |
19% |
| Law & Order: |
$64,297,952,416,211.93 |
10% |
| Commerce: |
$70,727,747,657,833.12 |
11% |
| Public Transport: |
$32,148,976,208,105.96 |
5% |
| The Environment: |
$64,297,952,416,211.93 |
10% |
| Social Equality: |
$19,289,385,724,863.58 |
3% |
|
|
|
The Iron Lions White Market Statistics ?
| Gross Domestic Product: |
$514,683,000,000,000.00 |
| GDP Per Capita: |
$27,401.53 |
| Average Salary Per Employee: |
$39,254.44 |
| Unemployment Rate: |
5.79% |
| Consumption: |
$6,799,408,360,325.12 |
| Exports: |
$85,968,859,168,768.00 |
| Imports: |
$79,636,822,228,992.00 |
| Trade Net: |
6,332,036,939,776.00 |
|
The Iron Lions Grey and Black Market Statistics ?
Evasion, Black Market, Barter & Crime
| Black & Grey Markets Combined: |
$2,109,563,076,207,799.25 |
| Avg Annual Criminal's Income / Savings: ? |
$176,105.12 |
| Recovered Product + Fines & Fees: |
$158,217,230,715,584.97 |
|
Black Market & Grey Market Statistics:
| Guns & Weapons: |
$105,665,377,533,403.39 |
| Drugs and Pharmaceuticals: |
$119,568,716,682,535.42 |
| Extortion & Blackmail: |
$111,226,713,193,056.20 |
| Counterfeit Goods: |
$169,620,737,619,410.72 |
| Trafficking & Intl Sales: |
$55,613,356,596,528.10 |
| Theft & Disappearance: |
$88,981,370,554,444.97 |
| Counterfeit Currency & Instruments : |
$158,498,066,300,105.06 |
| Illegal Mining, Logging, and Hunting : |
$69,516,695,745,660.12 |
| Basic Necessitites : |
$66,736,027,915,833.72 |
| School Loan Fraud : |
$122,349,384,512,361.81 |
| Tax Evasion + Barter Trade : |
$907,112,122,769,353.62 |
|
|
|
The Iron Lions Total Market Statistics ?
| National Currency: |
Lionisian Crown |
| Exchange Rates: |
1 Lionisian Crown = $1.54 |
| |
$1 = 0.65 Lionisian Crowns |
| |
Regional Exchange Rates |
| Gross Domestic Product: |
$514,683,000,000,000.00 - 20% |
| Black & Grey Markets Combined: |
$2,109,563,076,207,799.25 - 80% |
| Real Total Economy: |
$2,624,246,076,207,799.00 |
|


