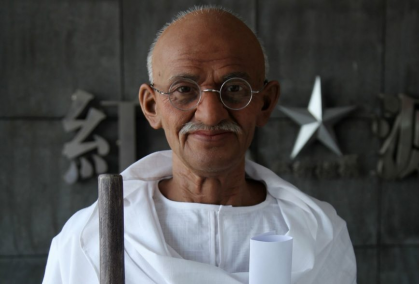
The Mahatma Gandhi Domestic Statistics
| Government Category: |
Commonwealth |
| Government Priority: |
Law & Order |
| Economic Rating: |
Frightening |
| Civil Rights Rating: |
Unheard Of |
| Political Freedoms: |
Rare |
| Income Tax Rate: |
87% |
| Consumer Confidence Rate: |
96% |
| Worker Enthusiasm Rate: |
95% |
| Major Industry: |
Information Technology |
| National Animal: |
Elephant |
|
The Mahatma Gandhi Demographics
| Total Population: |
15,323,000,000 |
| Criminals: |
1,017,003,573 |
| Elderly, Disabled, & Retirees: |
1,401,903,654 |
| Military & Reserves: ? |
653,397,550 |
| Students and Youth: |
3,251,540,600 |
| Unemployed but Able: |
1,874,009,912 |
| Working Class: |
7,125,144,712 |
|
|
|
The Mahatma Gandhi Government Budget Details
| Government Budget: |
$437,246,415,268,636.31 |
| Government Expenditures: |
$393,521,773,741,772.69 |
| Goverment Waste: |
$43,724,641,526,863.62 |
| Goverment Efficiency: |
90% |
|
The Mahatma Gandhi Government Spending Breakdown:
| Administration: |
$51,157,830,586,430.45 |
13% |
| Social Welfare: |
$7,870,435,474,835.45 |
2% |
| Healthcare: |
$47,222,612,849,012.72 |
12% |
| Education: |
$47,222,612,849,012.72 |
12% |
| Religion & Spirituality: |
$23,611,306,424,506.36 |
6% |
| Defense: |
$55,093,048,323,848.18 |
14% |
| Law & Order: |
$66,898,701,536,101.36 |
17% |
| Commerce: |
$43,287,395,111,594.99 |
11% |
| Public Transport: |
$0.00 |
0% |
| The Environment: |
$31,481,741,899,341.82 |
8% |
| Social Equality: |
$23,611,306,424,506.36 |
6% |
|
|
|
The Mahatma Gandhi White Market Statistics ?
| Gross Domestic Product: |
$309,152,000,000,000.00 |
| GDP Per Capita: |
$20,175.68 |
| Average Salary Per Employee: |
$25,720.92 |
| Unemployment Rate: |
9.35% |
| Consumption: |
$63,811,887,384,494.09 |
| Exports: |
$60,593,133,322,240.00 |
| Imports: |
$59,553,051,836,416.00 |
| Trade Net: |
1,040,081,485,824.00 |
|
The Mahatma Gandhi Grey and Black Market Statistics ?
Evasion, Black Market, Barter & Crime
| Black & Grey Markets Combined: |
$1,411,496,550,151,524.50 |
| Avg Annual Criminal's Income / Savings: ? |
$116,826.38 |
| Recovered Product + Fines & Fees: |
$179,965,810,144,319.38 |
|
Black Market & Grey Market Statistics:
| Guns & Weapons: |
$54,402,870,439,818.28 |
| Drugs and Pharmaceuticals: |
$73,707,114,789,431.20 |
| Extortion & Blackmail: |
$84,236,702,616,492.81 |
| Counterfeit Goods: |
$122,845,191,315,718.69 |
| Trafficking & Intl Sales: |
$24,569,038,263,143.74 |
| Theft & Disappearance: |
$63,177,526,962,369.61 |
| Counterfeit Currency & Instruments : |
$129,864,916,533,759.77 |
| Illegal Mining, Logging, and Hunting : |
$28,078,900,872,164.27 |
| Basic Necessitites : |
$38,608,488,699,225.88 |
| School Loan Fraud : |
$56,157,801,744,328.55 |
| Tax Evasion + Barter Trade : |
$606,943,516,565,155.50 |
|
|
|
The Mahatma Gandhi Total Market Statistics ?
| National Currency: |
India Coin |
| Exchange Rates: |
1 India Coin = $1.32 |
| |
$1 = 0.76 India Coins |
| |
Regional Exchange Rates |
| Gross Domestic Product: |
$309,152,000,000,000.00 - 18% |
| Black & Grey Markets Combined: |
$1,411,496,550,151,524.50 - 82% |
| Real Total Economy: |
$1,720,648,550,151,524.50 |
|


