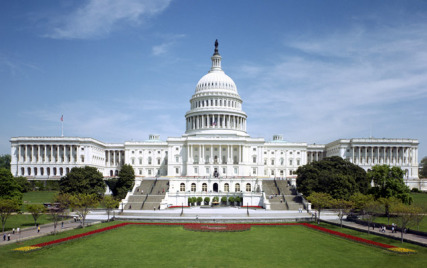
The United States Capitol Domestic Statistics
| Government Category: |
Building |
| Government Priority: |
Law & Order |
| Economic Rating: |
Good |
| Civil Rights Rating: |
Average |
| Political Freedoms: |
Excellent |
| Income Tax Rate: |
27% |
| Consumer Confidence Rate: |
100% |
| Worker Enthusiasm Rate: |
103% |
| Major Industry: |
Soda Sales |
| National Animal: |
bald eagle |
|
The United States Capitol Demographics
| Total Population: |
7,507,000,000 |
| Criminals: |
804,354,197 |
| Elderly, Disabled, & Retirees: |
872,933,286 |
| Military & Reserves: ? |
269,839,322 |
| Students and Youth: |
1,444,346,800 |
| Unemployed but Able: |
1,172,992,835 |
| Working Class: |
2,942,533,560 |
|
|
|
The United States Capitol Government Budget Details
| Government Budget: |
$22,512,997,800,114.91 |
| Government Expenditures: |
$22,062,737,844,112.62 |
| Goverment Waste: |
$450,259,956,002.30 |
| Goverment Efficiency: |
98% |
|
The United States Capitol Government Spending Breakdown:
| Administration: |
$0.00 |
0% |
| Social Welfare: |
$1,103,136,892,205.63 |
5% |
| Healthcare: |
$1,985,646,405,970.14 |
9% |
| Education: |
$5,295,057,082,587.03 |
24% |
| Religion & Spirituality: |
$3,088,783,298,175.77 |
14% |
| Defense: |
$3,088,783,298,175.77 |
14% |
| Law & Order: |
$5,515,684,461,028.15 |
25% |
| Commerce: |
$1,544,391,649,087.88 |
7% |
| Public Transport: |
$0.00 |
0% |
| The Environment: |
$661,882,135,323.38 |
3% |
| Social Equality: |
$0.00 |
0% |
|
|
|
The United States Capitol White Market Statistics ?
| Gross Domestic Product: |
$18,593,600,000,000.00 |
| GDP Per Capita: |
$2,476.83 |
| Average Salary Per Employee: |
$4,230.51 |
| Unemployment Rate: |
23.59% |
| Consumption: |
$42,374,949,125,488.64 |
| Exports: |
$7,720,352,645,120.00 |
| Imports: |
$8,054,885,580,800.00 |
| Trade Net: |
-334,532,935,680.00 |
|
The United States Capitol Grey and Black Market Statistics ?
Evasion, Black Market, Barter & Crime
| Black & Grey Markets Combined: |
$24,102,859,943,393.05 |
| Avg Annual Criminal's Income / Savings: ? |
$2,744.09 |
| Recovered Product + Fines & Fees: |
$4,519,286,239,386.20 |
|
Black Market & Grey Market Statistics:
| Guns & Weapons: |
$976,730,738,487.34 |
| Drugs and Pharmaceuticals: |
$1,562,769,181,579.75 |
| Extortion & Blackmail: |
$390,692,295,394.94 |
| Counterfeit Goods: |
$2,176,714,217,200.36 |
| Trafficking & Intl Sales: |
$474,412,072,979.57 |
| Theft & Disappearance: |
$502,318,665,507.78 |
| Counterfeit Currency & Instruments : |
$1,786,021,921,805.42 |
| Illegal Mining, Logging, and Hunting : |
$167,439,555,169.26 |
| Basic Necessitites : |
$948,824,145,959.13 |
| School Loan Fraud : |
$1,423,236,218,938.70 |
| Tax Evasion + Barter Trade : |
$10,364,229,775,659.01 |
|
|
|
The United States Capitol Total Market Statistics ?
| National Currency: |
dollar |
| Exchange Rates: |
1 dollar = $0.21 |
| |
$1 = 4.66 dollars |
| |
Regional Exchange Rates |
| Gross Domestic Product: |
$18,593,600,000,000.00 - 44% |
| Black & Grey Markets Combined: |
$24,102,859,943,393.05 - 56% |
| Real Total Economy: |
$42,696,459,943,393.05 |
|


