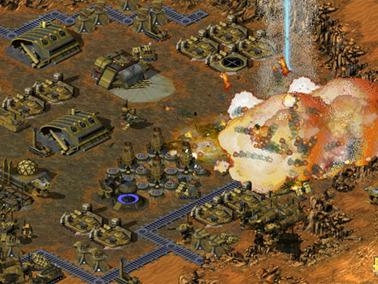
Tiberium War Domestic Statistics
| Government Category: |
Dominion |
| Government Priority: |
Law & Order |
| Economic Rating: |
Basket Case |
| Civil Rights Rating: |
Unheard Of |
| Political Freedoms: |
Some |
| Income Tax Rate: |
49% |
| Consumer Confidence Rate: |
87% |
| Worker Enthusiasm Rate: |
88% |
| Major Industry: |
Trout Farming |
| National Animal: |
Scorpion |
|
Tiberium War Demographics
| Total Population: |
2,832,000,000 |
| Criminals: |
340,281,669 |
| Elderly, Disabled, & Retirees: |
337,584,530 |
| Military & Reserves: ? |
105,502,610 |
| Students and Youth: |
522,504,000 |
| Unemployed but Able: |
459,378,577 |
| Working Class: |
1,066,748,614 |
|
|
|
Tiberium War Government Budget Details
| Government Budget: |
$428,256,352,507.00 |
| Government Expenditures: |
$402,560,971,356.58 |
| Goverment Waste: |
$25,695,381,150.42 |
| Goverment Efficiency: |
94% |
|
Tiberium War Government Spending Breakdown:
| Administration: |
$28,179,267,994.96 |
7% |
| Social Welfare: |
$32,204,877,708.53 |
8% |
| Healthcare: |
$40,256,097,135.66 |
10% |
| Education: |
$40,256,097,135.66 |
10% |
| Religion & Spirituality: |
$32,204,877,708.53 |
8% |
| Defense: |
$60,384,145,703.49 |
15% |
| Law & Order: |
$60,384,145,703.49 |
15% |
| Commerce: |
$20,128,048,567.83 |
5% |
| Public Transport: |
$32,204,877,708.53 |
8% |
| The Environment: |
$20,128,048,567.83 |
5% |
| Social Equality: |
$28,179,267,994.96 |
7% |
|
|
|
Tiberium War White Market Statistics ?
| Gross Domestic Product: |
$311,037,000,000.00 |
| GDP Per Capita: |
$109.83 |
| Average Salary Per Employee: |
$145.10 |
| Unemployment Rate: |
26.08% |
| Consumption: |
$387,899,584,020.48 |
| Exports: |
$96,590,302,208.00 |
| Imports: |
$113,576,747,008.00 |
| Trade Net: |
-16,986,444,800.00 |
|
Tiberium War Grey and Black Market Statistics ?
Evasion, Black Market, Barter & Crime
| Black & Grey Markets Combined: |
$1,272,606,355,368.89 |
| Avg Annual Criminal's Income / Savings: ? |
$311.66 |
| Recovered Product + Fines & Fees: |
$143,168,214,979.00 |
|
Black Market & Grey Market Statistics:
| Guns & Weapons: |
$54,721,277,901.89 |
| Drugs and Pharmaceuticals: |
$61,159,075,302.11 |
| Extortion & Blackmail: |
$38,626,784,401.33 |
| Counterfeit Goods: |
$88,519,714,253.06 |
| Trafficking & Intl Sales: |
$46,674,031,151.61 |
| Theft & Disappearance: |
$54,721,277,901.89 |
| Counterfeit Currency & Instruments : |
$94,957,511,653.28 |
| Illegal Mining, Logging, and Hunting : |
$28,970,088,301.00 |
| Basic Necessitites : |
$53,111,828,551.83 |
| School Loan Fraud : |
$40,236,233,751.39 |
| Tax Evasion + Barter Trade : |
$547,220,732,808.62 |
|
|
|
Tiberium War Total Market Statistics ?
| National Currency: |
Tiberium Shards |
| Exchange Rates: |
1 Tiberium Shards = $0.01 |
| |
$1 = 102.52 Tiberium Shardss |
| |
Regional Exchange Rates |
| Gross Domestic Product: |
$311,037,000,000.00 - 20% |
| Black & Grey Markets Combined: |
$1,272,606,355,368.89 - 80% |
| Real Total Economy: |
$1,583,643,355,368.89 |
|


