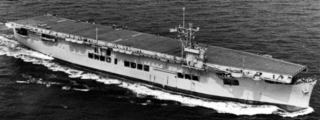
USS Sangamon Domestic Statistics
| Government Category: |
Empire |
| Government Priority: |
Defence |
| Economic Rating: |
Good |
| Civil Rights Rating: |
Good |
| Political Freedoms: |
Good |
| Income Tax Rate: |
19% |
| Consumer Confidence Rate: |
101% |
| Worker Enthusiasm Rate: |
103% |
| Major Industry: |
Information Technology |
| National Animal: |
Kitsune |
|
USS Sangamon Demographics
| Total Population: |
4,077,000,000 |
| Criminals: |
452,550,804 |
| Elderly, Disabled, & Retirees: |
558,151,957 |
| Military & Reserves: ? |
156,009,749 |
| Students and Youth: |
691,051,500 |
| Unemployed but Able: |
641,804,079 |
| Working Class: |
1,577,431,911 |
|
|
|
USS Sangamon Government Budget Details
| Government Budget: |
$9,680,228,693,657.52 |
| Government Expenditures: |
$9,293,019,545,911.22 |
| Goverment Waste: |
$387,209,147,746.30 |
| Goverment Efficiency: |
96% |
|
USS Sangamon Government Spending Breakdown:
| Administration: |
$929,301,954,591.12 |
10% |
| Social Welfare: |
$1,022,232,150,050.23 |
11% |
| Healthcare: |
$1,022,232,150,050.23 |
11% |
| Education: |
$929,301,954,591.12 |
10% |
| Religion & Spirituality: |
$278,790,586,377.34 |
3% |
| Defense: |
$1,393,952,931,886.68 |
15% |
| Law & Order: |
$1,393,952,931,886.68 |
15% |
| Commerce: |
$371,720,781,836.45 |
4% |
| Public Transport: |
$929,301,954,591.12 |
10% |
| The Environment: |
$371,720,781,836.45 |
4% |
| Social Equality: |
$464,650,977,295.56 |
5% |
|
|
|
USS Sangamon White Market Statistics ?
| Gross Domestic Product: |
$8,163,320,000,000.00 |
| GDP Per Capita: |
$2,002.29 |
| Average Salary Per Employee: |
$3,499.36 |
| Unemployment Rate: |
24.08% |
| Consumption: |
$25,785,928,840,642.56 |
| Exports: |
$4,421,538,750,464.00 |
| Imports: |
$4,341,526,691,840.00 |
| Trade Net: |
80,012,058,624.00 |
|
USS Sangamon Grey and Black Market Statistics ?
Evasion, Black Market, Barter & Crime
| Black & Grey Markets Combined: |
$9,547,663,551,832.57 |
| Avg Annual Criminal's Income / Savings: ? |
$1,758.12 |
| Recovered Product + Fines & Fees: |
$1,074,112,149,581.16 |
|
Black Market & Grey Market Statistics:
| Guns & Weapons: |
$380,356,538,568.56 |
| Drugs and Pharmaceuticals: |
$422,618,376,187.29 |
| Extortion & Blackmail: |
$338,094,700,949.83 |
| Counterfeit Goods: |
$639,964,969,655.04 |
| Trafficking & Intl Sales: |
$326,019,890,201.62 |
| Theft & Disappearance: |
$386,393,943,942.66 |
| Counterfeit Currency & Instruments : |
$784,862,698,633.54 |
| Illegal Mining, Logging, and Hunting : |
$217,346,593,467.75 |
| Basic Necessitites : |
$446,767,997,683.71 |
| School Loan Fraud : |
$289,795,457,957.00 |
| Tax Evasion + Barter Trade : |
$4,105,495,327,288.01 |
|
|
|
USS Sangamon Total Market Statistics ?
| National Currency: |
Delta Eagle |
| Exchange Rates: |
1 Delta Eagle = $0.19 |
| |
$1 = 5.19 Delta Eagles |
| |
Regional Exchange Rates |
| Gross Domestic Product: |
$8,163,320,000,000.00 - 46% |
| Black & Grey Markets Combined: |
$9,547,663,551,832.57 - 54% |
| Real Total Economy: |
$17,710,983,551,832.57 |
|


