Opaloka Domestic Statistics
| Government Category: |
Council-Republic |
| Government Priority: |
Education |
| Economic Rating: |
Strong |
| Civil Rights Rating: |
Some |
| Political Freedoms: |
Few |
| Income Tax Rate: |
100% |
| Consumer Confidence Rate: |
99% |
| Worker Enthusiasm Rate: |
77% |
| Major Industry: |
Information Technology |
| National Animal: |
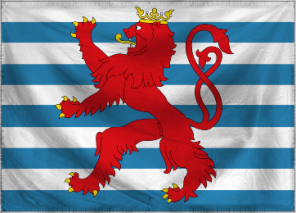
Red Lion |
|
Opaloka Demographics
| Total Population: |
7,356,000,000 |
| Criminals: |
756,214,277 |
| Elderly, Disabled, & Retirees: |
386,091,254 |
| Military & Reserves: ? |
256,059,696 |
| Students and Youth: |
1,839,000,000 |
| Unemployed but Able: |
1,091,877,851 |
| Working Class: |
3,026,756,922 |
|
|
|
Opaloka Government Budget Details
| Government Budget: |
$57,689,179,945,288.34 |
| Government Expenditures: |
$53,074,045,549,665.27 |
| Goverment Waste: |
$4,615,134,395,623.06 |
| Goverment Efficiency: |
92% |
|
Opaloka Government Spending Breakdown:
| Administration: |
$3,184,442,732,979.92 |
6% |
| Social Welfare: |
$6,368,885,465,959.83 |
12% |
| Healthcare: |
$3,715,183,188,476.57 |
7% |
| Education: |
$9,553,328,198,939.75 |
18% |
| Religion & Spirituality: |
$0.00 |
0% |
| Defense: |
$6,899,625,921,456.49 |
13% |
| Law & Order: |
$4,776,664,099,469.87 |
9% |
| Commerce: |
$2,653,702,277,483.26 |
5% |
| Public Transport: |
$3,715,183,188,476.57 |
7% |
| The Environment: |
$4,776,664,099,469.87 |
9% |
| Social Equality: |
$5,307,404,554,966.53 |
10% |
|
|
|
Opaloka White Market Statistics ?
| Gross Domestic Product: |
$42,731,300,000,000.00 |
| GDP Per Capita: |
$5,809.04 |
| Average Salary Per Employee: |
$6,995.32 |
| Unemployment Rate: |
20.31% |
| Consumption: |
$0.00 |
| Exports: |
$7,573,451,112,448.00 |
| Imports: |
$6,701,268,336,640.00 |
| Trade Net: |
872,182,775,808.00 |
|
Opaloka Grey and Black Market Statistics ?
Evasion, Black Market, Barter & Crime
| Black & Grey Markets Combined: |
$192,925,985,698,405.16 |
| Avg Annual Criminal's Income / Savings: ? |
$19,685.25 |
| Recovered Product + Fines & Fees: |
$13,022,504,034,642.35 |
|
Black Market & Grey Market Statistics:
| Guns & Weapons: |
$6,665,423,995,642.41 |
| Drugs and Pharmaceuticals: |
$8,203,598,763,867.58 |
| Extortion & Blackmail: |
$5,639,974,150,158.96 |
| Counterfeit Goods: |
$10,510,860,916,205.34 |
| Trafficking & Intl Sales: |
$5,896,336,611,529.83 |
| Theft & Disappearance: |
$8,716,323,686,609.31 |
| Counterfeit Currency & Instruments : |
$11,023,585,838,947.07 |
| Illegal Mining, Logging, and Hunting : |
$6,409,061,534,271.55 |
| Basic Necessitites : |
$13,330,847,991,284.82 |
| School Loan Fraud : |
$11,536,310,761,688.79 |
| Tax Evasion + Barter Trade : |
$82,958,173,850,314.22 |
|
|
|
Opaloka Total Market Statistics ?
| National Currency: |
Volksgeld |
| Exchange Rates: |
1 Volksgeld = $0.38 |
| |
$1 = 2.64 Volksgelds |
| |
Regional Exchange Rates |
| Gross Domestic Product: |
$42,731,300,000,000.00 - 18% |
| Black & Grey Markets Combined: |
$192,925,985,698,405.16 - 82% |
| Real Total Economy: |
$235,657,285,698,405.16 |
|


