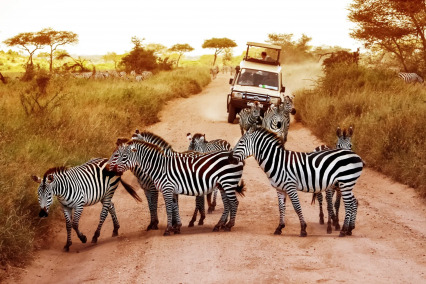
Safari Domestic Statistics
| Government Category: |
Free Land |
| Government Priority: |
Law & Order |
| Economic Rating: |
Very Strong |
| Civil Rights Rating: |
Very Good |
| Political Freedoms: |
World Benchmark |
| Income Tax Rate: |
7% |
| Consumer Confidence Rate: |
103% |
| Worker Enthusiasm Rate: |
107% |
| Major Industry: |
Woodchip Exports |
| National Animal: |
Wildlife |
|
Safari Demographics
| Total Population: |
5,510,000,000 |
| Criminals: |
574,421,916 |
| Elderly, Disabled, & Retirees: |
792,410,972 |
| Military & Reserves: ? |
370,538,897 |
| Students and Youth: |
914,384,500 |
| Unemployed but Able: |
853,533,273 |
| Working Class: |
2,004,710,442 |
|
|
|
Safari Government Budget Details
| Government Budget: |
$18,016,358,753,800.03 |
| Government Expenditures: |
$17,836,195,166,262.03 |
| Goverment Waste: |
$180,163,587,538.00 |
| Goverment Efficiency: |
99% |
|
Safari Government Spending Breakdown:
| Administration: |
$0.00 |
0% |
| Social Welfare: |
$713,447,806,650.48 |
4% |
| Healthcare: |
$3,032,153,178,264.55 |
17% |
| Education: |
$3,032,153,178,264.55 |
17% |
| Religion & Spirituality: |
$0.00 |
0% |
| Defense: |
$4,637,410,743,228.13 |
26% |
| Law & Order: |
$5,350,858,549,878.61 |
30% |
| Commerce: |
$713,447,806,650.48 |
4% |
| Public Transport: |
$0.00 |
0% |
| The Environment: |
$0.00 |
0% |
| Social Equality: |
$0.00 |
0% |
|
|
|
Safari White Market Statistics ?
| Gross Domestic Product: |
$16,702,300,000,000.00 |
| GDP Per Capita: |
$3,031.27 |
| Average Salary Per Employee: |
$5,968.41 |
| Unemployment Rate: |
23.02% |
| Consumption: |
$84,728,201,368,043.53 |
| Exports: |
$12,588,730,859,520.00 |
| Imports: |
$12,447,189,565,440.00 |
| Trade Net: |
141,541,294,080.00 |
|
Safari Grey and Black Market Statistics ?
Evasion, Black Market, Barter & Crime
| Black & Grey Markets Combined: |
$9,711,690,904,416.18 |
| Avg Annual Criminal's Income / Savings: ? |
$1,903.93 |
| Recovered Product + Fines & Fees: |
$2,185,130,453,493.64 |
|
Black Market & Grey Market Statistics:
| Guns & Weapons: |
$557,718,129,413.36 |
| Drugs and Pharmaceuticals: |
$546,992,780,770.80 |
| Extortion & Blackmail: |
$85,802,789,140.52 |
| Counterfeit Goods: |
$1,008,182,772,401.07 |
| Trafficking & Intl Sales: |
$0.00 |
| Theft & Disappearance: |
$364,661,853,847.20 |
| Counterfeit Currency & Instruments : |
$922,379,983,260.56 |
| Illegal Mining, Logging, and Hunting : |
$0.00 |
| Basic Necessitites : |
$268,133,716,064.12 |
| School Loan Fraud : |
$364,661,853,847.20 |
| Tax Evasion + Barter Trade : |
$4,176,027,088,898.96 |
|
|
|
Safari Total Market Statistics ?
| National Currency: |
Stamp |
| Exchange Rates: |
1 Stamp = $0.34 |
| |
$1 = 2.98 Stamps |
| |
Regional Exchange Rates |
| Gross Domestic Product: |
$16,702,300,000,000.00 - 63% |
| Black & Grey Markets Combined: |
$9,711,690,904,416.18 - 37% |
| Real Total Economy: |
$26,413,990,904,416.18 |
|


